
Forecasting Lazarus Crypto Heists
Data-Driven Insights into a Decade of Lazarus Crypto Heists

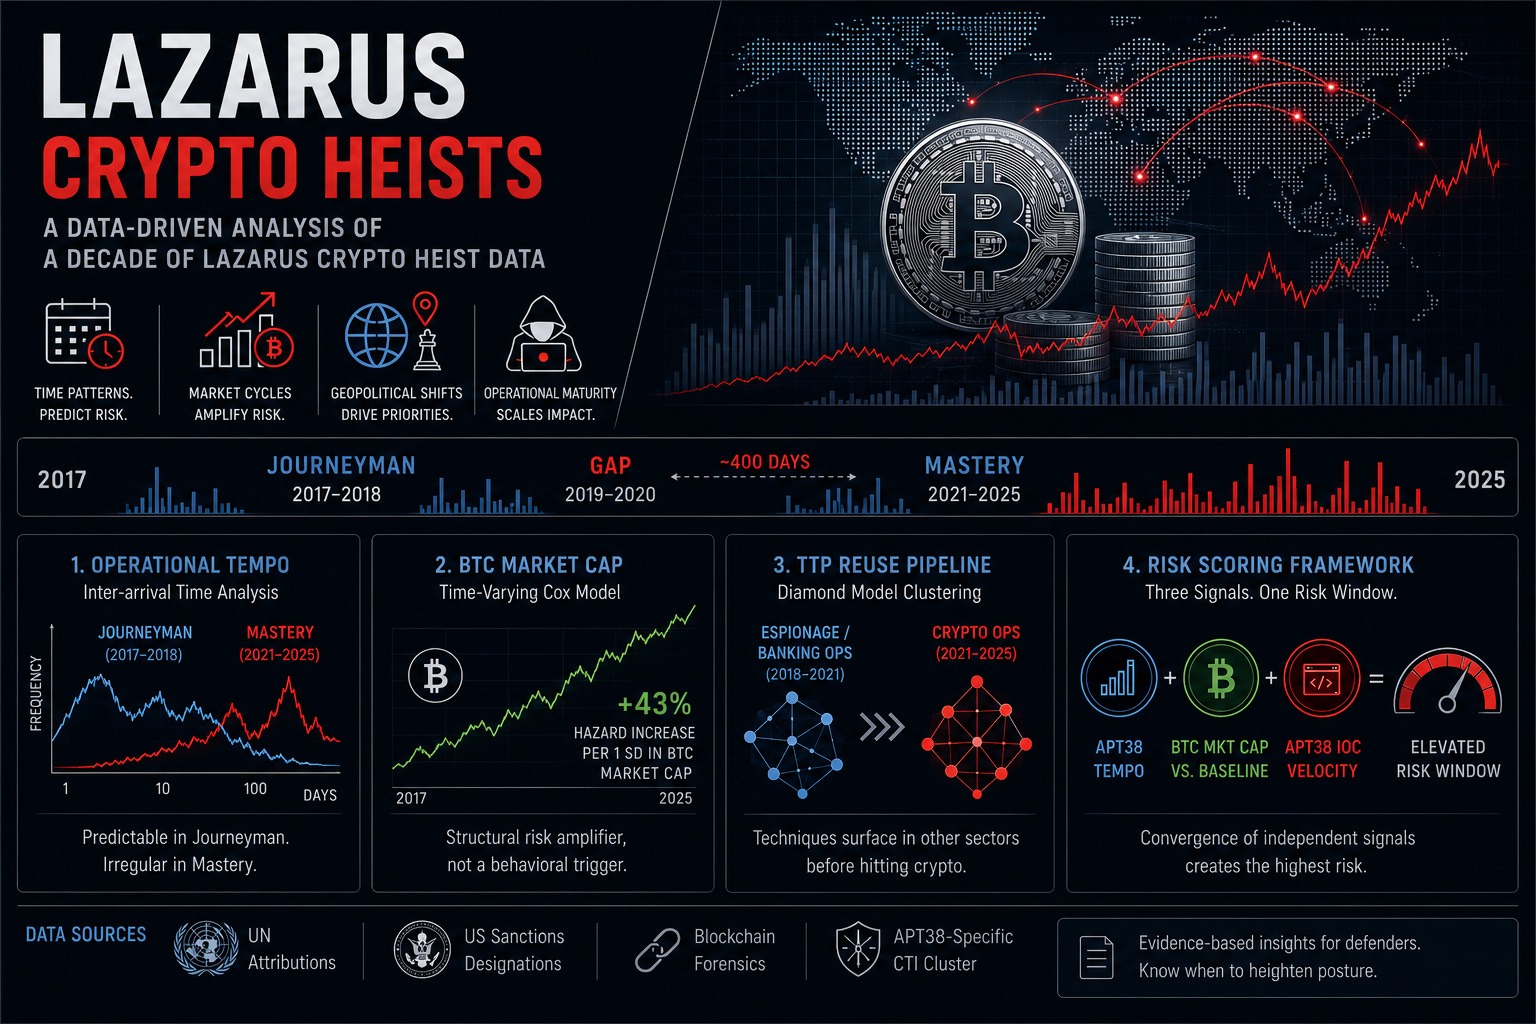
Lazarus Group’s hacks are not randomly distributed across time. Their frequency, tempo, and targeting scope are demonstrably shaped by external conditions. Namely, market cycles, geopolitical priorities and operational maturity. That structure is exploitable for risk forecasting. The research summarized here, co-authored with Ahmet Zamanis (ING Hubs Türkiye), applies time-series analysis, survival modeling, and Diamond Model clustering to years worth of attributed incidents with a specific goal: identifying the structural conditions that correlate with elevated attack risk. The intended use is risk window identification and covariate weighting for analysts and defenders who need to know when to heighten posture, not just what happened after the fact.
The dataset covers 2017–2025 and was constructed from UN attributions, US sanctions designations and blockchain forensic analyses. For IOC-level signal we exclusively used a private CTI vendor’s APT38-specific cluster rather than the broader Lazarus umbrella. This was a deliberate trade-off of coverage for attribution confidence, given that APT38 maps specifically to financially-motivated operations rather than the full spectrum of DPRK cyber activity.
One limitation worth stating upfront is that the dataset carries inherent temporal uncertainty. The majority of incidents are timestamped to detection or public disclosure rather than actual compromise. This affects the precision of any timing-based analysis and shapes what the findings can and cannot claim (more on that in the final section).
Predictability of Operational Tempo
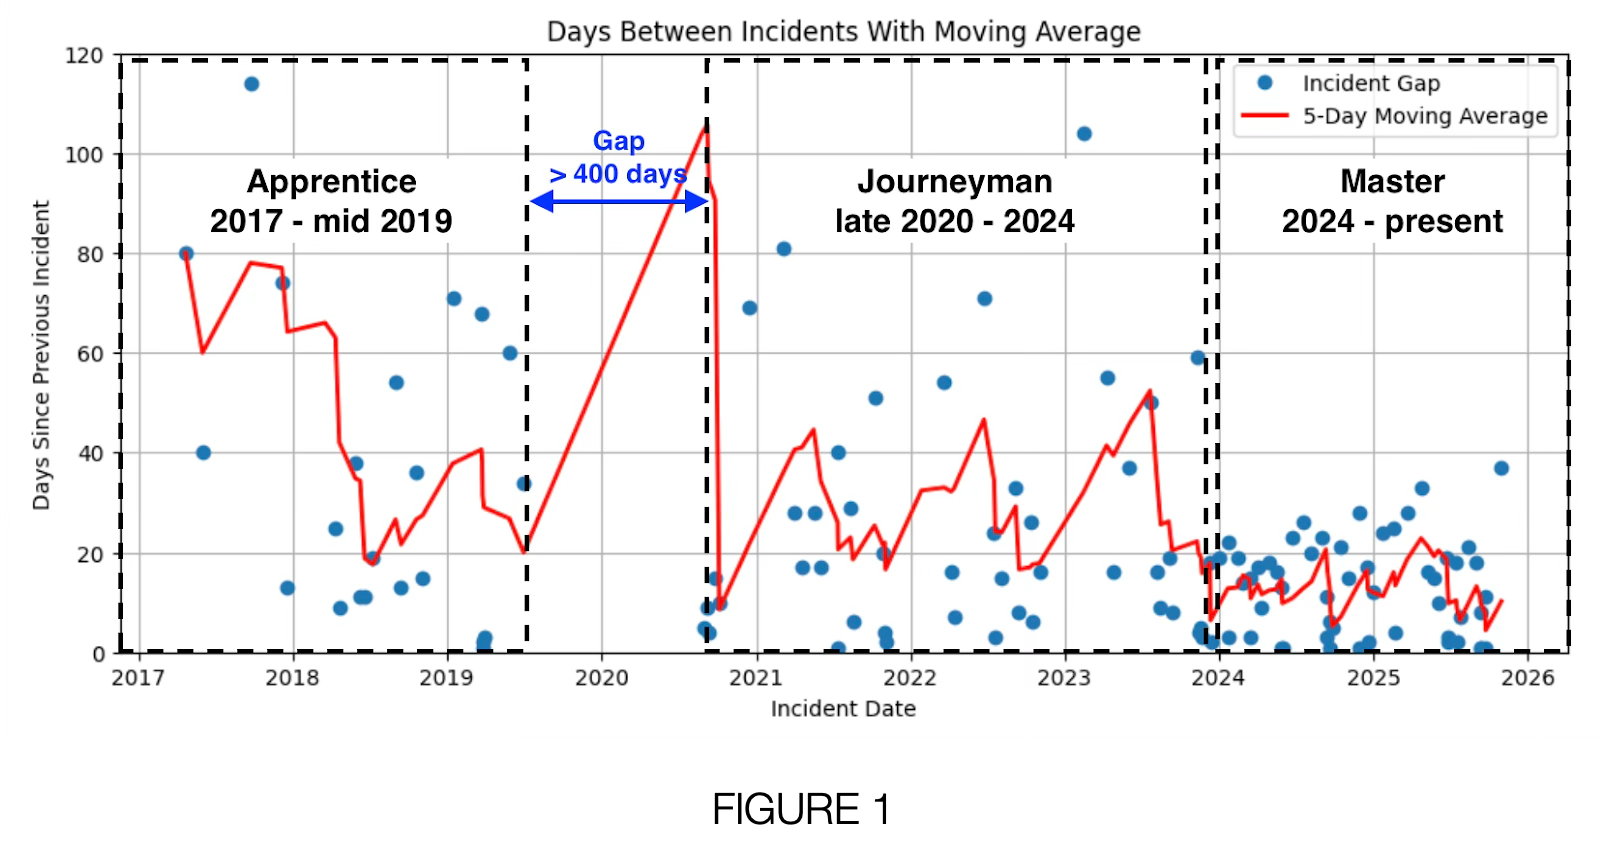
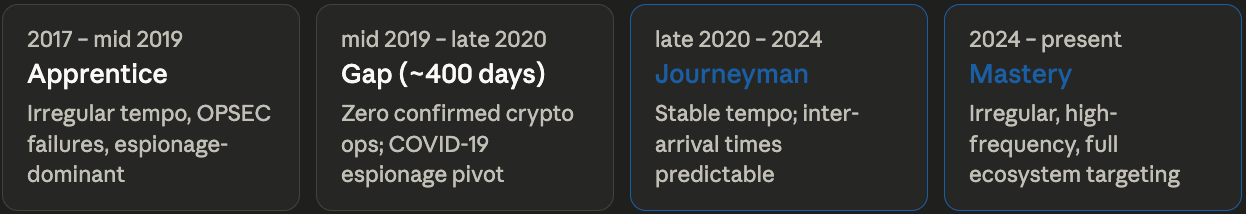
Inter-arrival time analysis across the full dataset reveals that temporal predictability is phase-dependent. During the Journeyman phase, the distribution of gaps between confirmed incidents was stable enough (exhibiting an M-shaped pattern between 1 and 20 days) that attack windows could be anticipated with reasonable confidence. That property does not hold in the current Mastery phase, where interval regularity has collapsed alongside a significant expansion of targeting scope and TTP diversity.
Practical Takeaway
The practical implication extends beyond Lazarus: during the Journeyman phase the operational tempo remained stable for years which could be leveraged as a predictive signal. For analysts working other intrusion sets, this suggests that temporal modeling becomes viable when a threat actor exhibits sustained behavioral regularity.
The 2019–2020 Gap
The ~400-day absence of confirmed crypto operations overlaps with documented Lazarus espionage activity targeting COVID-19 vaccine research and pharmaceutical infrastructure. One potential explanation is capacity reallocation. North Korea’s offensive cyber departments operates under finite resource constraints and appears to require explicit prioritization trade-offs between mission sets.
Practical Takeaway
Track the espionage layer as a leading indicator. A geopolitical inflection point followed by a Kimsuky or Lazarus espionage surge has historically preceded a lull in APT38 crypto operations.
That said, this dynamic may no longer hold cleanly. The Mastery phase suggests Lazarus has deliberately decoupled crypto ops from internal capacity constraints through outsourcing and the use of fraudulent IT workers. The resource trade-off that produced the 2019–2020 gap may not be reproducible under the current operational model.
BTC Market Cap as a Time-Varying Covariate
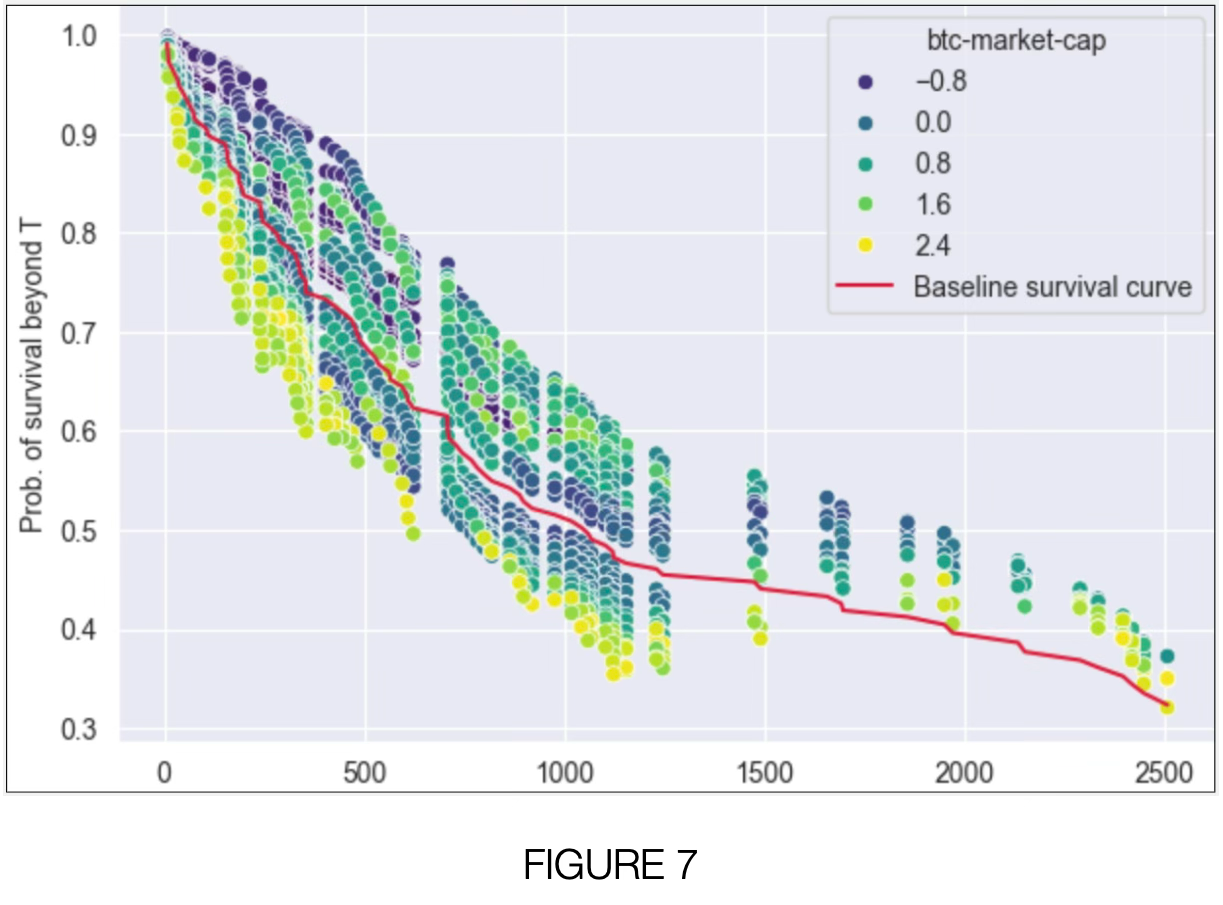
The time-varying Cox proportional hazards model treats each targeted organization’s exposure period as a survival timeline, with a confirmed hack as the terminal event. This formulation handles the zero-inflated, bursty nature of the incident data better than standard classifiers and accommodates both internal activity indicators (IOC commit velocity, rolling incident counts) and external market variables as time-varying covariates.
Bitcoin market capitalization shows a statistically significant positive association with hazard rate, concentrated in the post-2020 period. A one standard deviation increase in BTC market cap corresponds to approximately a 43% increase in estimated hazard. This effect is robust across the leave-one-out sensitivity analysis, meaning no single organization disproportionately drives the estimate.
Practical Takeaway
The mechanism is likely indirect: bull market conditions accelerate sector growth, compress development timelines, and expand the denominator of exploitable targets rather than directly modulating Lazarus operational tempo. This means BTC market cap functions as a structural risk amplifier in the model, not a behavioral trigger. Incorporating it as a covariate in organizational risk is defensible; treating it as a leading indicator of imminent Lazarus activity is not.
Cross-sector TTP Reuse as a Leading Indicator
Diamond Model clustering across the full incident set surfaces a consistent pattern: techniques are operationalized in other sectors before appearing in crypto campaigns. The Contagious Interview cluster (now widely known in crypto targeting) is structurally derivative of the 2021 operations against zero-day vulnerability researchers. The RedBanc/Chile and Pakistan banking intrusions from 2018–2019 predate near-identical access patterns in later Operation DreamJob variants by approximately three years.
This reflects an operational scaling dynamic: Lazarus appears to be under pressure to expand throughput, and the path of least resistance is adapting proven tradecraft from adjacent mission sets rather than developing new TTPs for each target sector.
Practical Takeaway
High-confidence Lazarus and Kimsuky espionage campaigns, particularly those targeting South Korean defense, academic, and research entities should be treated as a TTP pipeline for future crypto operations. Integrating espionage campaign tracking into your crypto threat model can prove valuable.
Operationalizing the findings
The findings above can be integrated into existing CTI workflows as additional covariates and alerting conditions. The conceptual framework is a composite risk score built from multiple inputs: current operational phase, BTC market capitalization relative to a rolling baseline, and APT38 IOC commit velocity. The signal strength emerges from their convergence: when all indicators are simultaneously elevated the risk window is at its highest.
Input 1 → Monitor APT38 operational tempo
Track inter-arrival times between confirmed incidents using public sources (Chainalysis, UN Panel reports, ZachXBT). A sustained drop below historical baseline warrants pivot detection. Source: open reporting aggregated against your existing Lazarus incident tracker.
Input 2 → BTC market cap vs. 90-day rolling mean
When BTC market cap exceeds its 90-day rolling mean by more than one standard deviation, flag as elevated risk environment. This is a structural amplifier rather than a trigger. Use it to modulate posture. Source: CoinGecko or Glassnode API, trivial to automate.
Input 3 → APT38 IOC commit rate (21-day rolling sum)
Rising IOC commit velocity from a vendor with a dedicated APT38 cluster is a leading indicator of pre-incident infrastructure activity. Spike detection on a 21-day rolling window outperforms daily thresholds given the bursty distribution of the underlying data.
Input 4 → Kimsuky/Lazarus non-crypto TTP tracking
Maintain a parallel track on high-confidence Lazarus and Kimsuky espionage campaigns targeting South Korean entities. New TTPs surfacing in that context, particularly novel social engineering patterns should be queued for crypto-sector adaptation assessment.
Note on data sources: the APT38-specific IOC cluster used in this study came from a commercial vendor that maintains explicit sub-group separation. Not all CTI platforms do. If your current provider lumps APT38 activity under the broader Lazarus tag, the IOC velocity signal will carry significantly more noise. It’s worth flagging to your vendor or accounting for it in your spike detection thresholds.
Acknowledgements
I would like to thank Nihat Alpcan Onaran for his contributions throughout this research. His expertise in Web3 security was invaluable in keeping the findings grounded in operational reality.
The full paper is linked below. If you're looking to extend or replicate the methodology, start with section 2 for dataset construction and attribution criteria, and section 5C for the Cox model assumptions and diagnostics.