
Wargaming Insights: Is Investing in a SOC Worth It?
A Markov Chain Simulation to compare two competing strategies

In the 1980s, the US faced an overwhelming Soviet nuclear arsenal. The conventional wisdom held that any shield arrayed against them would have to be virtually perfect. Wargames explored the impact of US missile defenses on Soviet offensive planning. Interestingly, even a modest 15% defense capability forced the Soviets to exhaust their arsenal before achieving all objectives. Because of its concern about taking out high-priority targets that might be defended, Moscow had to add to its original operations plan in almost every case.
This story, taken from Wargaming for Leaders, illustrates how simulations can help to understand the impact of strategies on adversary decision-making. In the context of cyber security, wargaming can be used to simulate different threat scenarios and test how various defense strategies might influence the outcome of those attacks.
What is Wargaming?
Wargaming is a method of simulating attack and defense scenarios to evaluate how different strategies affect the outcome of an adversary’s actions.
By using wargaming, security teams can model cyber threat scenarios, apply different defense measures (like firewalls, endpoint protection, and SOCs), and observe how these defenses alter the attacker’s likelihood of success. This provides a better understanding of where resources should be allocated and how to improve defense measures.
In this post, we’ll use wargaming to evaluate whether investing in security detection and response capabilities is worthwhile. The approach involves modeling a simple cyber intrusion as a Markov Chain and adding a detection step to analyze how it affects the likelihood of a successful attack.
If you wonder what Markov Chains are, check out our previous blog post on this topic:

Disclaimer: Please note that the models in this post are deliberately oversimplified. They are designed to demonstrate the application of Markov Chains in simulation modeling. As such, they abstract away many real-world factors such as adaptive attacker behavior, response times, and cost of implementation. A more detailed model could be built to incorporate those factors, but that would go beyond the purpose of this post.
Strategy 1: Prevention Only
In this first Markov Chain model, we simulate a scenario where there are no detection or response capabilities, relying solely on preventive measures. Each step of the attack is represented by a probability of success, reflecting how likely the attacker is to complete each phase of the attack.
There are four layers of preventive controls:
Email filtering to block potentially malicious emails.
Security awareness training to reduce the click-through rate of phishing emails.
Malware protection to prevent the execution of malicious files.
Data loss prevention systems to block the exfiltration of sensitive data.
By measuring the false negative and true positive rates of each layer, we can calculate the probabilities of success. For example, phishing emails reported by employees would be considered false negatives for our email filtering control.
Here’s how the Markov chain looks like for this scenario:

To calculate the overall probability of success, we multiply the success probabilities at each step:
P = 0.9 × 0.8 × 0.85 × 1.0 × 1.0 × 0.8 = 0.4896
This means the attacker has a 48.96% probability of success against this defensive strategy.
Strategy 2: Detection & Response
In the second Markov Chain, we add detection as an additional control. For each attack step, there’s now a 10% chance of the attack being detected. Once detected, the attack has a 10% chance of triggering an incident response, which mitigates it. Here’s how the progression looks with detection in place:

Now, we calculate the combined success probability with detection and response by multiplying the success and detection survival rates at each step:
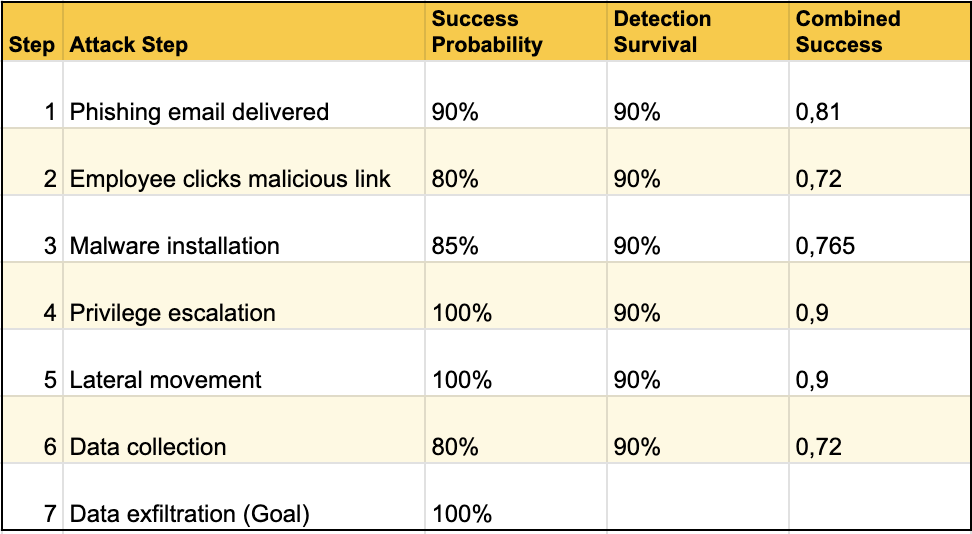
P = 0.81 × 0.72 × 0.765 × 0.9 × 0.9 × 0.72 = 0.2601
With detection & response procedures in place the attacker now has only a 26% probability of success.
Attempts Needed to Succeed
We can now compare how many attempts an attacker would need to succeed in both scenarios. This is done by calculating the expected number of attempts (1 divided by the success probability) for each condition:
Strategy #1: 1 ÷ 0.48 = 2 attempts
Strategy #2: 1 ÷ 0.26 = ~3.84 attempts
Adding a 10% detection probability nearly doubles the difficulty for the attacker, from around 2 attempts to 3.84 attempts to succeed.
To better understand how different defensive strategies impact the attack outcome, we’ll compare two performance scale plots. Each plot highlights how detection capabilities and layered defenses scale differently in terms of difficulty for attackers to reach its goal.
Defense in Depth Performance
This plot shows how Difficulty increases in multiplies as more defense layers are added, with blocking success ranging from 10% to 50%.

How to interpret this plot:
When layers individually block a higher percentage of attacks (e.g., 40–50%), difficulty multiplies sharply with each additional layer.
With lower blocking rates (e.g., 10–20%), difficulty still increases, but at a slower rate.
The shape of the curves depends strongly on the blocking effectiveness of each layer.
Insight:
This strategy scales more effectively with the quality of individual layers than with the number of layers themselves. Therefore, focusing solely on the number of defenses without considering the efficiency of each layer will lead to a suboptimal strategy.
Detection and Response Performance
This second plot shows the relationship between Detection Success (%) and the difficulty for an attacker to achieve its objective. This scenario assumes that the incident response will completely eradicate the threat. However in reality, this is less often the case due to inefficiencies in incident response procedures.
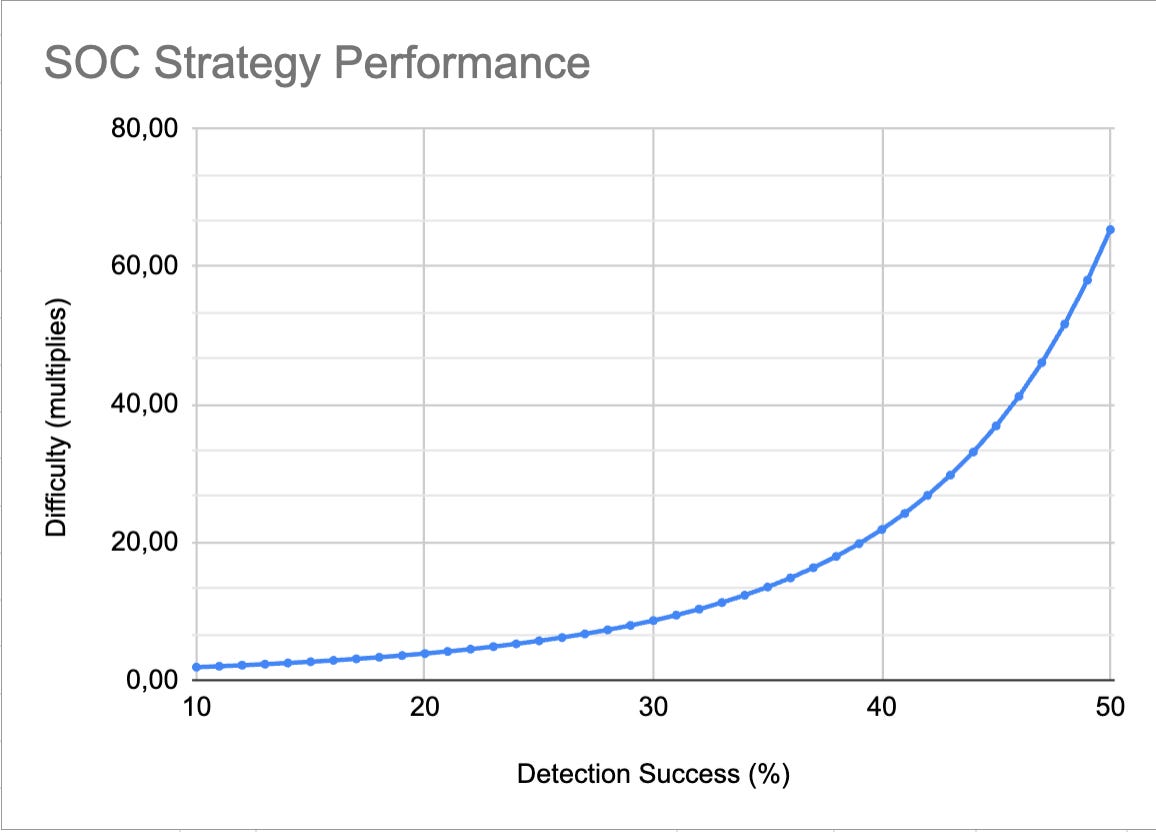
How to interpret this plot:
As detection success improves, difficulty for the attacker increases polynomially.
As detection success moves higher (e.g., 40% to 50%), the difficulty rises much more steeply.
Insight:
A detection and response strategy becomes more effective against attackers as it scales. The key idea is that the cost of implementing detection at all layers is lower than the cost of preventive controls at each layer. This allows the strategy to scale by improving detection efficiency, whereas a preventive strategy requires considering the cost of defense at each individual layer. But it's also important to note that the effectiveness of this strategy depends on efficient incident response, which must be factored in as well.
Let’s compare the two strategies:
With three layers of preventive controls, each blocking 50% of attacks, the difficulty for the attacker increases by 8x. (Defense in Depth)
To achieve the same effectiveness with the second strategy, only 30% detection success per step is needed. (Detection and Response)
Conclusion
Wargaming can be an effective way to test different cybersecurity strategies and understand their potential impact on an attack's success.
The precision of the numbers aren't important, nor are they particularly reliable.
Instead, what really matters is the directional insight: even limited detection capabilities can significantly disrupt intrusions, essentially showing that a SOC acts as a powerful force multiplier.